TBR has been evaluating the changing nature of technology alliances through its subscription and commissioned research for decades. A series of best practices have emerged, most often developed by young technology companies, while the commercial impediments seem more acute for legacy vendors with their employees’ resistance to change. The balance of this document will discuss the successful approaches vendors have shared with TBR, and what end customers and small technology companies have shared with us as the anachronisms associated with legacy partner program structures.
Why the urgency in alliance program evolutions?
The ICT market landscape has undergone a massive transformation since the advent of more customer-friendly cloud subscription and consumption models. Traditional enterprise application software incumbents like Oracle, Microsoft and SAP were the first entities forced to transition their business models to thwart cloud natives like Salesforce from poaching their existing install base.
But the disruption to the enterprise application space was only the beginning, as customer preference for subscription-based pricing soon bled across the IT stack, upending the traditional on-premises data center market at an ever-increasing rate. Specifically, as client trust in the security, uptime and resiliency of cloud infrastructure alternatives strengthened, buyers facing on-premises hardware refresh cycles increasingly sought to migrate their workloads to public and private cloud environments instead.
The outbreak of COVID-19 in 2020 forced large portions of the global economy to operate remotely and resulted in a substantial acceleration of clients’ IT modernization efforts. This dynamic helped jump-start cloud adoption among laggard businesses, as challenges ranging from scrutiny over the security of public cloud environments to internal change management issues delaying executive buy-in on projects were superseded by the need to sustain the business continuity of a remote workforce.
This background was not intended to provide a history lesson on a now-well-understood ICT evolution but rather to offer some context to better understand how partner ecosystem models must now similarly evolve to support the aspirations of a rapidly maturing enterprise customer base.
The benefits customers receive from cloud, such as continuous updates to deployed solutions and greater flexibility in the vendors they procure solutions from, must be built into the design of vendors’ partner programs, as the programs of old, which were built to support vendor-to-partner engagement models, will hamstring vendors’ cloud market development efforts. The evolving ecosystem strategies of Microsoft and Salesforce reflect this shift.
TBR has been evaluating the changing nature of technology alliances through its subscription and commissioned research for decades. A series of best practices have emerged, most often developed by young technology companies, while the commercial impediments seem more acute for legacy vendors with their employees’ resistance to change. The balance of this document will discuss the successful approaches vendors have shared with TBR, and what end customers and small technology companies have shared with us as the anachronisms associated with legacy partner program structures.
But first, the TBR analytical framework
TBR has developed an analytical framework to examine ecosystem value propositions. This framework evaluates alliances across three core elements:
- The Ecosystem Value Chain assesses the different components of a solution stack, and we list end users given they inform the technology community of what they seek. User-driven solutions are a significant departure from the way selling was done in the past, and this selling shift is currently a big challenge legacy technology vendors face.
- Industry elements are a critical solution delineator. Industries can have specific requirements, especially around compliance. Additionally, large vendors will evaluate smaller partners against this layer for IP that provides them with market distinction in that segment.
- Business Value Chain is where a lot of the challenges reside. Often, these different components have been evaluated from the vantage point of the large vendor that sponsors and promotes the partnerships. These aspects have historically been fashioned in a way to easily accommodate the operational idiosyncrasies of the sponsoring vendor.
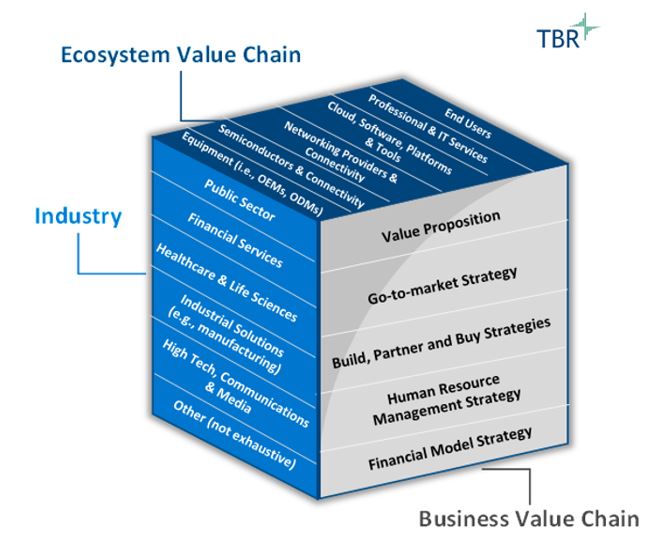
The ecosystem and industry aspects refer largely to the assembly of the technology and talent and are not where the challenges lie in alliance partnerships. Talent is not limited to technical talent, either. Having talent that understands the buyer’s business is, at times, more important than the technology itself.
The technology evolutions are placing incredible amounts of pressure on legacy business value chains. Industry shorthand has discussed this as the consumerization of IT for years. Whatever you call it, technology is not the challenges buyers see. Hybrid infrastructure is past the proof-of-concept phase for enterprise buyers. Buyers just want assurance the tech stack works, is secure, in regulatory compliance, and has addressed the fundamental business objectives.
As such, buyers have precious little patience for challenges in how they seek to consume technology and technology services, and this is a major competitive attack point cloud-native vendors can wield against legacy vendors.
Commercial terms of yesteryear are not aligned to flexible buyer consumptions patterns
Commercial terms and definitions have been the domain of large technology vendors. Large technology vendors dictated the terms to other vendors and, in large part, to end customers. This hub-spoke relationship style allowed big vendors to dictate the terms to distributors, VARs, ISVs and OEMs. Legal wrote the terms to protect the big vendor, and the small vendors had little room for negotiation.
Strategic alliances have been (and continue to be) negotiated agreements between two large firms seeing mutual benefit. The large vendors did not necessarily follow the standardized agreements pushed to small vendors.
But today’s IT buying patterns require the integration of technology assets and services from multiple vendors. Enterprise software may have to run on premises and in the cloud, requiring agreements with major cloud providers, the system integrator providing advisory services to the end customer, and the infrastructure supplier for the on-premises infrastructure equipment. Where complexity arises now is with the increase of niche application software vendors that end customers want integrated into their solutions. Interoperability integral to consumerizing IT reduces barriers to entry to these unique IP services that many more large enterprises want to consume.
Small vendors in the past were slotted into those big vendor commercial constructs. Today, however, these smaller vendors, particularly if they serve a very narrow niche, can be called on for services, for development work, or just for the niche software based on system integrator evaluation and standardization around that application.
Large vendor resistance to change is increasingly a competitive liability
Cloud-native companies are known for simpler commercial terms. From interviews with cloud-native executives, TBR has heard a very consistent story: The cloud native rallying cry is merely a percentage of net revenue (PNR). Cloud-native application vendors do not necessarily care which vendor is prime to the customer as long as the PNR quotient is transferred to them. As many cloud vendors will state, all they care about is “spinning the meter.”
On the other side of this situation is cloud-native executives’ frustration around engaging with traditional enterprise application vendors. The litany of challenges shared with TBR in these discussions cut across most of the business operations, with technology release cycles and commercial terms as the most pressing concerns.
- Does the traditional enterprise application vendor have one version of its code in the market?
- What are the commercial terms?
- Enterprise application vendors can prohibit smaller vendors from selling directly into named accounts. In some scenarios, it could be the niche application vendor that has gained the account attention with a solution for a unique business workflow.
In discussions with TBR, executives’ reasons for the resistance to change relate not to customers but rather to the internal change management and the lack of appetite for effecting that change.
- Executive compensation metrics are often tied to these siloed business performance metrics. Determining how to change the commercial engagement model for multiparty flexibility means tweaking some of the most emotional aspects managers have to consider: the impact on their compensation and their team’s compensation.
- Internal software development in these traditional firms has been migrating to faster release cycles. Some of the teams may be further behind on the transformation, triggering resistance to the notion of synchronized IP versions across their various channels and end markets.
- Few line managers want to confront the retirement of legal debt. The idea of convincing general counsel to scrap legacy contract terms and embrace a simplification of those terms can get “what if’d” to death.
Large system integrators have been coming to the rescue
TBR has seen a notable shift in system integrator messaging. Vendor agnosticism is less compelling as buyers have become more interested in just knowing something will work as promised. As such, large system integrators have taken to providing recommendations on different IP elements. To TBR, this is the 21st century equivalent of the successful 20th century market messaging of “Intel Inside.” Tagging a solution as “SI certified” assures the end customer that the IP will work as specified and provides a highly valued technology brand to hold accountable in the event it does not.
From an administrative perspective, many system integrators take on the role of orchestrator. These SIs, especially the Big Four (Deloitte, EY, KPMG and PwC), understand the regulatory landscape and can keep workflows current while also handling the commercial interactions between hyperscalers, enterprise application vendors, infrastructure suppliers and maintenance providers. In essence, the SIs become the ecosystem administrator given their high-value brand cache with end customers and their detailed familiarity with complex accounting, however unnecessary and unwarranted that complexity might be within the solution assembly itself.
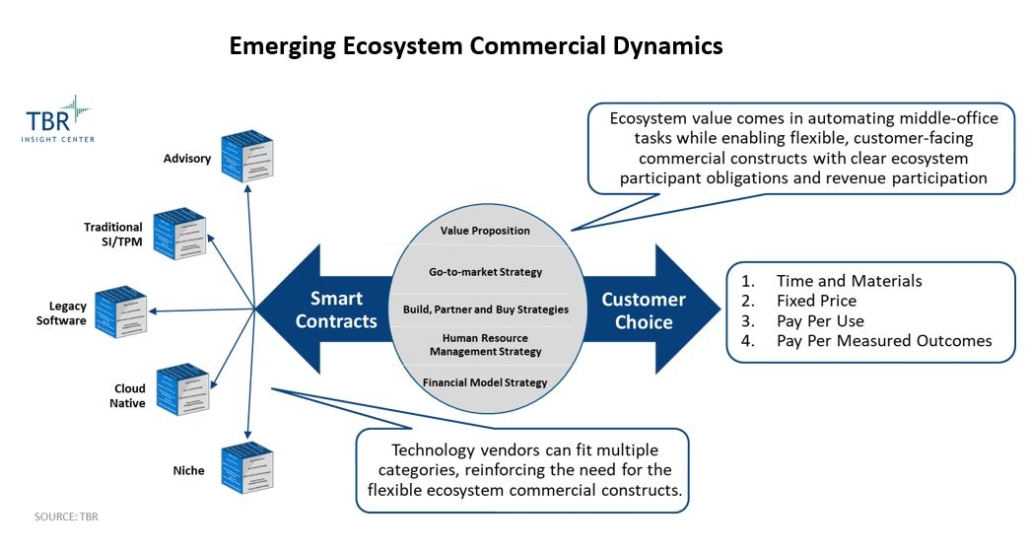
Long-term, TBR envisions the use of smart contracts with revenue-sharing metrics. Regardless of which vendor is prime on the agreement, the roles the participants play determine the set percentage of the net revenue shared. This construct is fundamentally different from the cost-plus or margin-stacking agreements that were the de facto standard, 20th century partner agreements. While these contracts can be established and monitored without blockchain, blockchain can greatly simplify the commercial agreements and simultaneously address service-level agreement (SLA) obligations to the end customer from the multiple parties.
Examples of these multiparty strategic alliances are legion. Many leading SIs have practices built around legacy software vendors such as SAP and Oracle, and all are building out hyperscaler competencies as ITO opportunities in legacy infrastructure start to wind down. ServiceNow, Salesforce, Workday and Microsoft Dynamics are cloud-native application sets with growing gravity centers in large enterprises.
Niche vendors spring up as business formation costs decline. Many provide a unique, narrowly focused service or set of services that are built to easily plug into leading application layers, often through simple API connections. This niche value is often critical to the buyer decision-making process because of its ability to solve an acute business pain point.
For now, as ecosystem commercial terms remain siloed, sclerotic and overly bureaucratic, some enterprises turn to their incumbent SI to serve as the overall solution administrator or solution orchestrator. The point, however, is clear: Customers want tech solutions that work; they want simple contract administration; and they are not willing to pay a premium to cover the administrative bloat associated with having their technology partners determine how to allocate their revenue or cover their technical support requirements.
Big vendors need to focus on their legacy middle-office practices
Another emerging theme TBR has encountered in its executive interviews is the concept of performance-based compensation. This construct has been discussed — usually termed outcome-based pricing — for close to a decade.
In the beginning, SIs told TBR the biggest resistance to these kinds of arrangements was middle management’s concern about the financial exposure of such agreements. However, as the SIs have established more automated workflows, the concept has come back under the banner of being performance based. Small firms wedded to legacy SaaS models might need to get more creative in aligning their commercial offers with the needs of larger SIs seeking to create market distinctiveness with such commercial innovations.
Small vendors have to consider approaching big vendors as if they seek investors
As TBR found during interviews with leaders of small SaaS vendors, some of their challenges have not shifted in decades and continue to revolve around the time commitment of their staff when seeking to establish and forge a relationship with a firm several hundred times larger. Numerous interviews laid out a consistent blueprint for successful engagement with big vendors that consists of three major elements:
- Are you a strategic fit with the large vendor? If yes, then:
- How do you approach the large vendor for top-down attention within the firm?
- How do you initially engage the large organization for positive, bottom-up, word-of-mouth marketing inside the large vendor?
Assessing strategic fit
- What is the strategic focus of that large vendor, and does it align with your firm’s aspirations?
- What is the vendor’s revenue within the space?
- Is it a strategic growth segment where the vendor will see value in your offer?
- What is the large vendor’s current sales structure by customer size and by industry segment?
- How does the big vendor measure partner success and does its view of success align with your measure of partner success?
- What is the overall working relationship between the large alliance vendor and its smaller participants?
-
- General go-to-market motions
- Deal registration rigor
- Joint selling
- Commercial arrangements
- Marketplace access
- Technical and sales certification requirements
- Access to experts for guidance and for ad hoc training
- Electronic tool sets, documentation and self-paced training
- Large vendor tech stack
- Release cycles and release versions across the different partner classifications
- Underlying infrastructure technology and compatibility to your stack
- Response times and supportiveness of its technical personnel, especially for DevOps testing
Top-down attention grabbing
In almost prospectus fashion, small vendors should highlight known customer overlap and customers that may present an opportunity to the large vendor. This is where knowledge of the large vendor’s strategic focus comes into play. The top-down efforts also have to establish those critical contacts with big vendor decision makers who can provide the small vendor with guidance around navigating the organizational labyrinth to get things done operationally. Every corporation has a style and a preferred way of working. These senior leaders, if they are sold on the value proposition, essentially become the small vendor’s mentor or coach on how best to engage the broader organization.
Bottom-up or word-of-mouth marketing
Small vendors have two audiences to convince: development and sales. While selling is the obvious aspiration, the first move is often to understand the DevOps practices deployed by the large firm as well as prove the technical rigor of the application and the distinctiveness of the functional services the IP enables. Just as it is important to forge the executive connections, the development connections help prove value and mitigate technical challenges down the road by knowing who to contact when in need of assistance.
Sales engagement works best when the small vendor can essentially deliver some opportunities to the large vendor on a platter. Call this focusing on low-hanging fruit, but make sure the first opportunities engaging the large seller organization are highly qualified situations for your value proposition. Again, small vendors should outline several overlapping accounts to the large vendor and highlight the opportunity the small vendor can provide to the large vendor within those accounts.
One or two early wins become the internal promotional marketing pieces to prove value to the large vendor sellers. Saying no to certain opportunities helps to establish credibility as much as winning deals.
Planning and careful rollouts are critical to alliance success
Time and again in small vendor interviews, TBR heard that without strategic planning and measured rollout of the engagement small firms can dilute their own sales focus. In this way the large alliance can actually impede the small vendor’s progress rather than accelerate it. Commercial terms can hamstring deal progress, but poorly vetted sales opportunities can likewise drain small vendor market momentum.
Our most-read analysis, free in your inbox each week — Subscribe today!
Nothing Found
Sorry, no posts matched your criteria